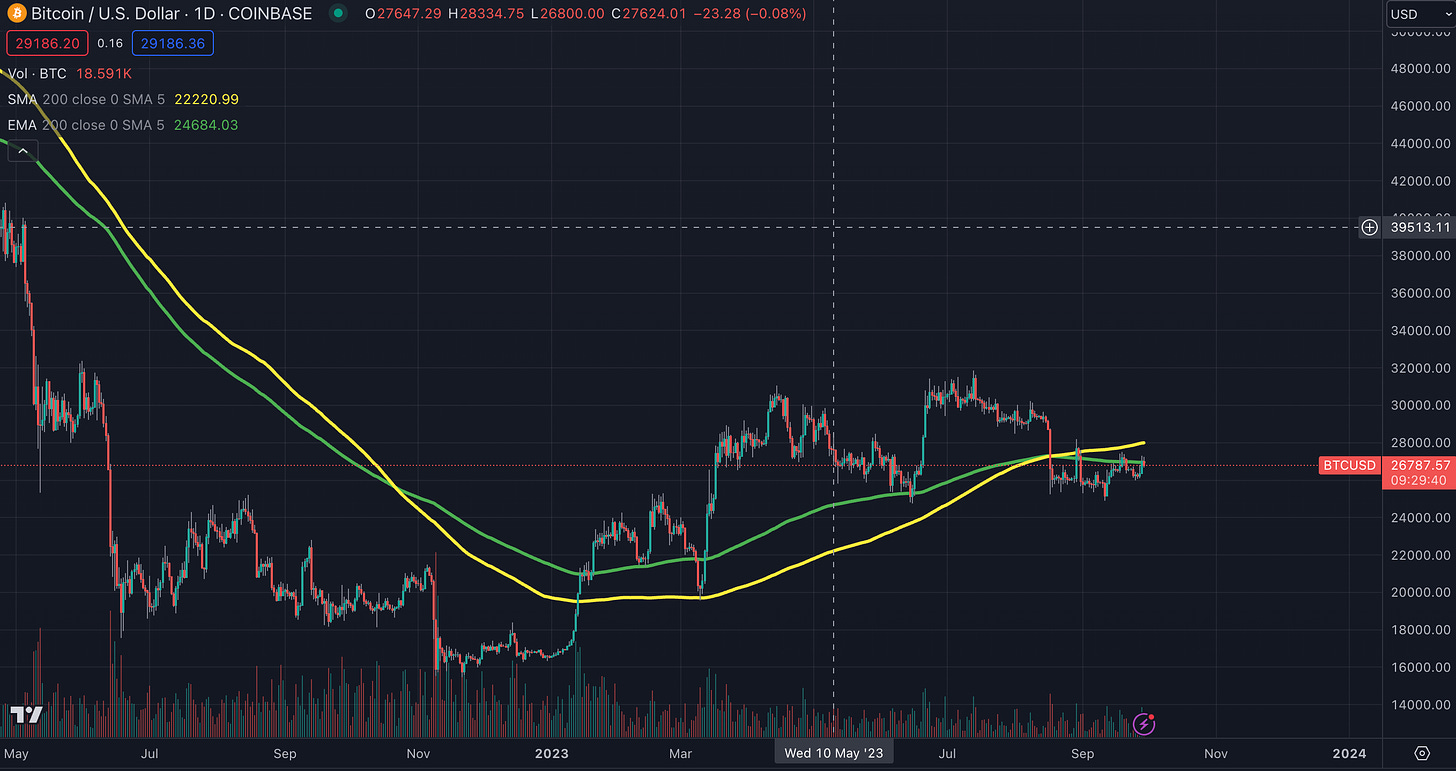
Check out these two super bearish #Bitcoin charts (short-term). They're messing with my vibes, especially with BTC struggling to stay above $27,000. 😬📉
Look at BTC against the 200-day moving average cloud.
🔵 200-day EMA $26,950
🟡 200-day SMA $28,000
This range has been a big deal for BTC, especially in the last 18 months.
Looks like it might be playing hard to get again. 🙄🚫
BTC and that short-term holder price thing (STHRP).
Think of STHRP as a mood ring for BTC.
Price above STHRP? 🚀 Bullish vibes.
Price below it? 📉 Bearish mood.
And hey, even if this chart doesn't show every little detail, STHRP's at $27,720. Just so you know. 😉
Putting those two together, here's the deal:
200-day MA cloud is chillin' between $27k and $28k.
STHRPAt $27.7k.
So, there's a big "STOP!" sign around mid-$27k for $BTC, pushing it down a bit.
Personally I think this is bearish in the near term. If we can break it then we’re bullish again but not yet.


